Introduction in PK analysis
PK/PD and PB/PK
- Pharmacokinetics (PK): study of the kinetics (movement) of a substance through an organism
- Pharmacodynamics (PD): study of the effects of a substance on the body
- PK/PD: study the relations between PK and PD (e.g. concentration-effect relation)
- Physiology-based PK (PB/PK): start with a mathmetical model a priori to describe the processes of or within an orgasnism based on mechanistic insights from in vitro and ex vivo experiments

ADME kinetics
ADME refers to the processes of Absoprtion, Distribution, Metabolism and Excretion. These processes occur at certain rates. Think of a drug moving from one area to another, like the gut to the plasma or transforms at a certain rate from the parent compund into metabolites. The primary focus of Pharmacokinetic (PK) analysis is studying these rates and 'movements' (kinetics).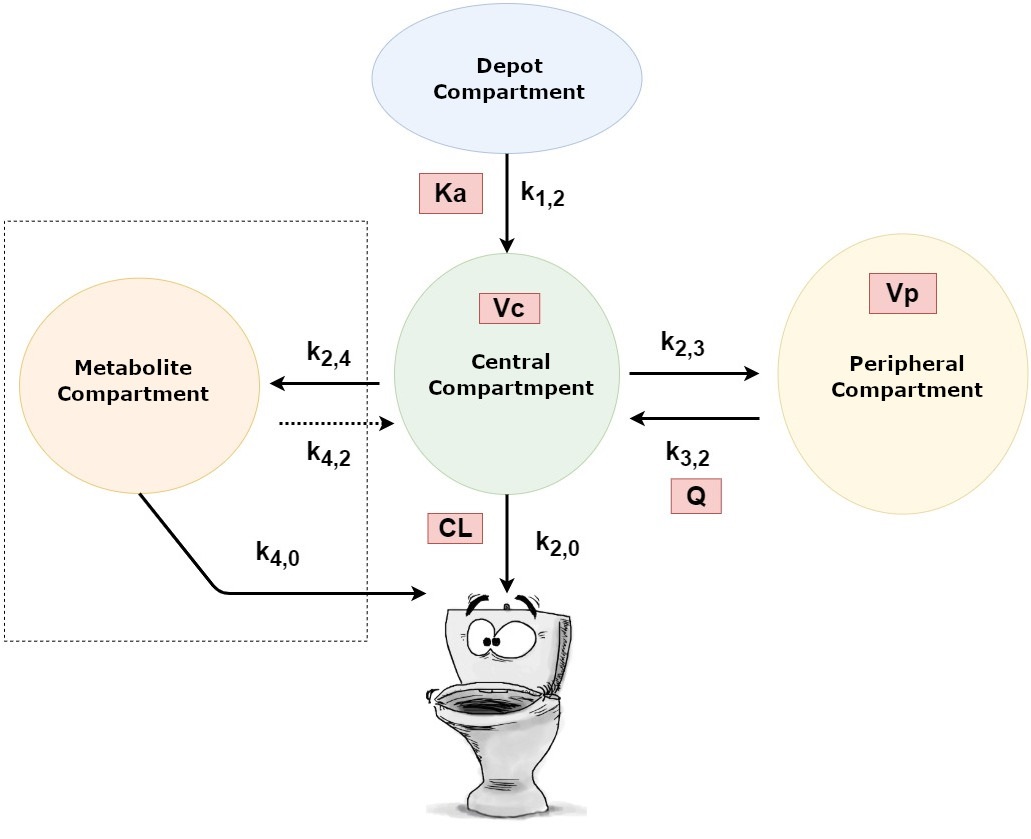
k : rate constants (kinetic) --> movement from 'x' to 'y'
- Ka: absorption constant
- Vc: distribution compartment (central)
- Q: rate constant between Vc and Vp
- Vp: distribution compartment (periph.)
- CL: elimination constant (clearance)
Methods of PK analyses
Many methods are available for PK analyses. Common traditional methods are for example:Naive pooled data analysis (NPD) [rich and scarce data]
- Combines all data as if it concerns a single patient
Standard two-stage approach (STS) [rich data]
- Step 1: Calculate PK parameters of each individual
- Step 2: Combine results (e.g. average of all individuals)
Iterative two-stage approach (IT2S) [rich data]
- Step 1 and 2 same as STS
- Iterative: repeat step 1 with results of step 2 until no further improvement occurs
Data pooling:
Combine data of multiple subjects to create a 'population' curve.
As subjects (e.g. 2 and 6 in the figure below) lack data for an individual curve.
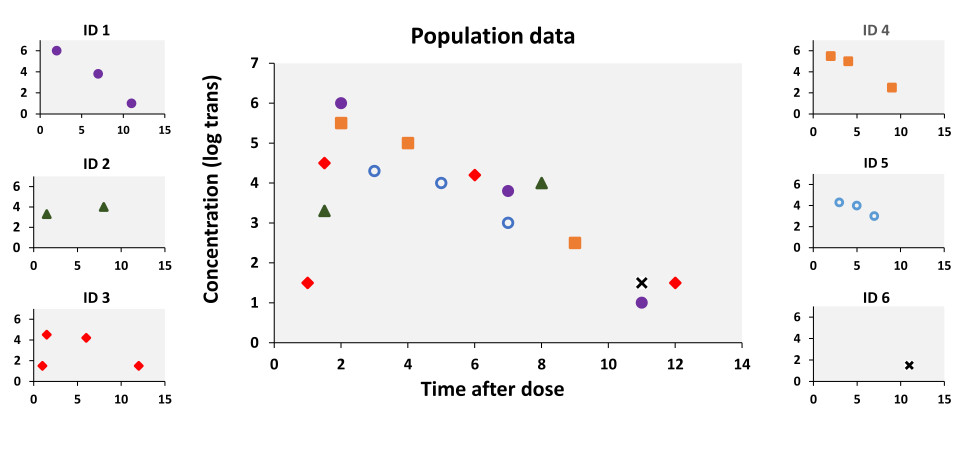
However, the main issue is retaining information concerning the individual with pooled data including subjects with sparse data. Currently a popular method is non-linear mixed effects modelling approach. With this method sparse and dense sampling can be used while being able to provide information concerning individual subjects through the use of stochastic models.
Non-linear mixed effects approach [NLME] [rich and scarce data]
- Designed to fit non linear statistical regression-type models
- Simultanious determine fixed and random effects in a population
Mixed effects refer to the mix of fixed and random effects:
- Fixed effects: input data (dosis, concentration, patient characteristics etc.)
- Fixed effect parameters: population parameters of fixed effects (e.g pop CL)
- Random effects: variability within the popPK parameters (IIV/BSV, IOV, res variability)
Structural model
A mathematical model which best describes the data- Describe the relations between dose, concentration and time
- Compare the fit of different mathematical models on the data
- Minimize the discrepancy between observations and model predictions (without overfitting)
- A priori information (known relations, initial estimates)

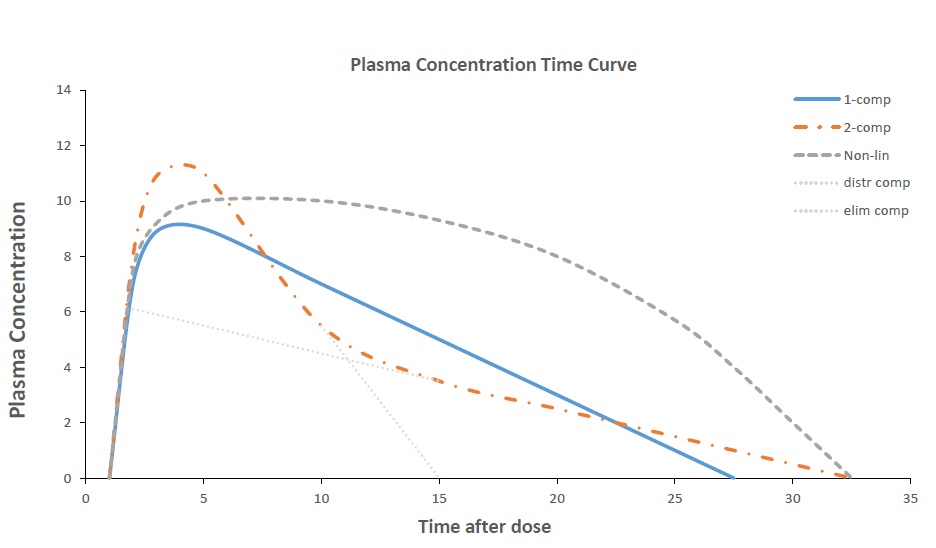
What kind of 'shape' does the data show? What kind of data do we have?
- Absorption phase?
- 1-compartment?
- 2-compartments?
- Linear?
- Saturation?
- Metabolites?
- Protein binding?
Stochastic model
Describe, explain, and predict the variability in observations (random effects)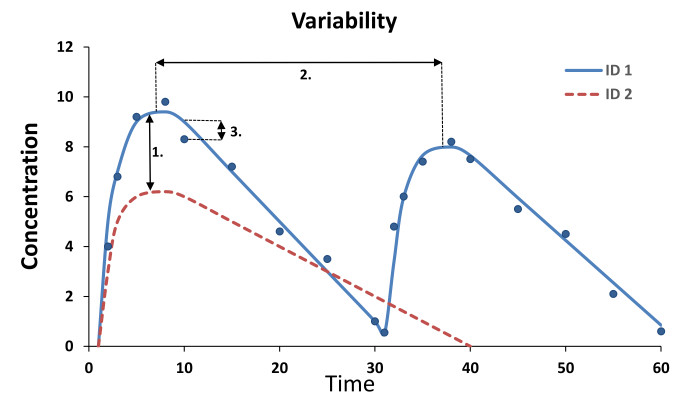
- Interindividual variability (IIV)
- Interoccasion variability (IOV)
- Residual variability
Quiz
This is a small quiz to familiarize oneself with the effects of changing PK parameters in NONMEM models.
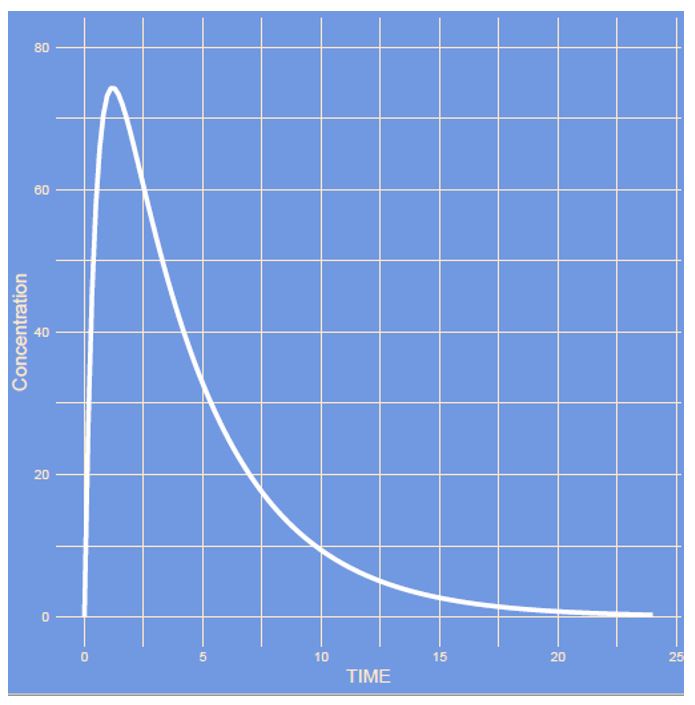
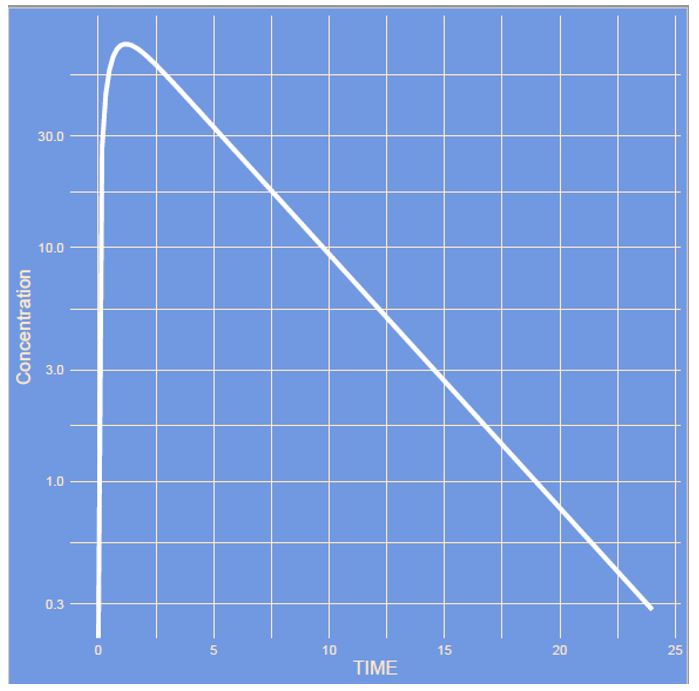 The figures on the left shows a simulation of a simple one-compartment model with first-order absorption on a linear and semi log scale. During this quiz PK parameters like clearance, variability but also model structure will be modified. See whether you can guess what parameter has changed.
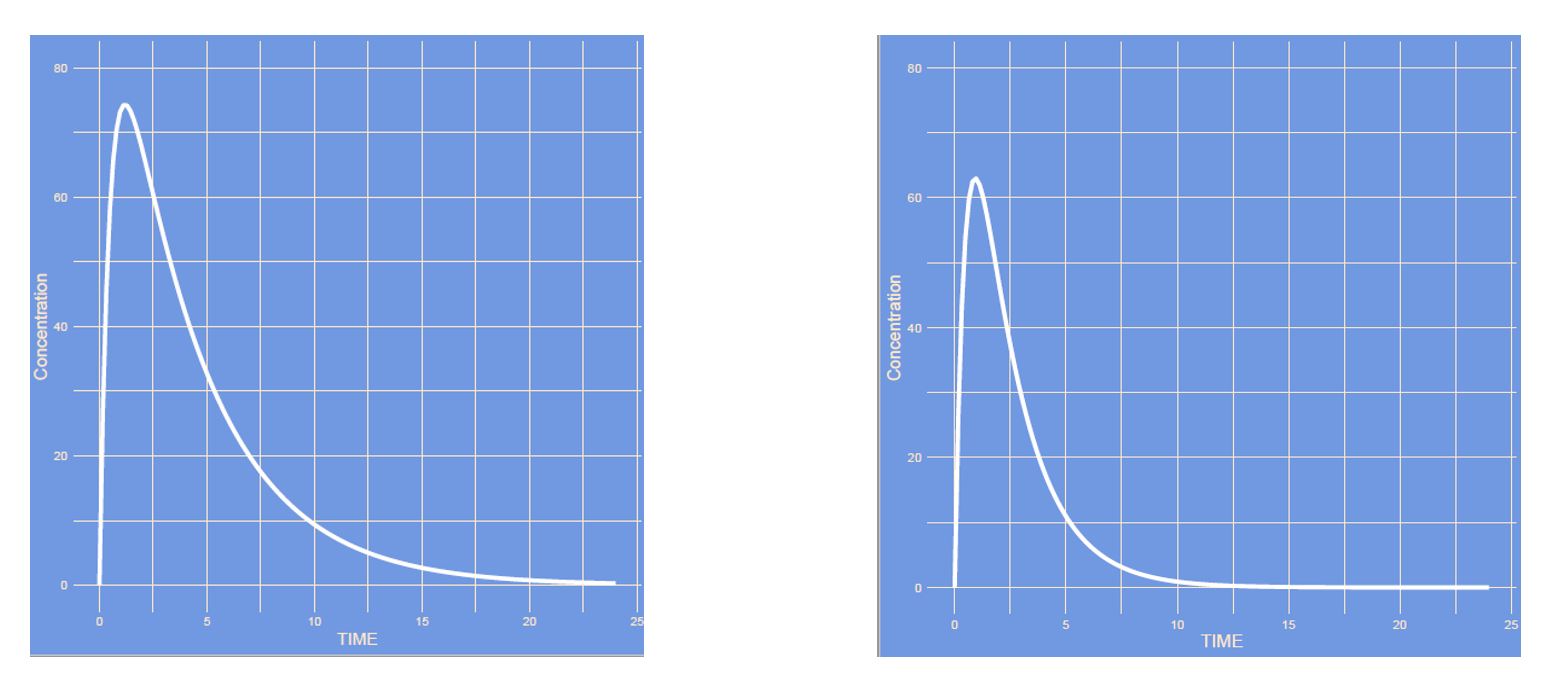
Which parameter changed?
Answer
The clearance was increased, where all other parameters remain unaltered. The drug will leave the body faster, hence the slope of the curve is steeper, peak somewhat lower and area under the curve is lower.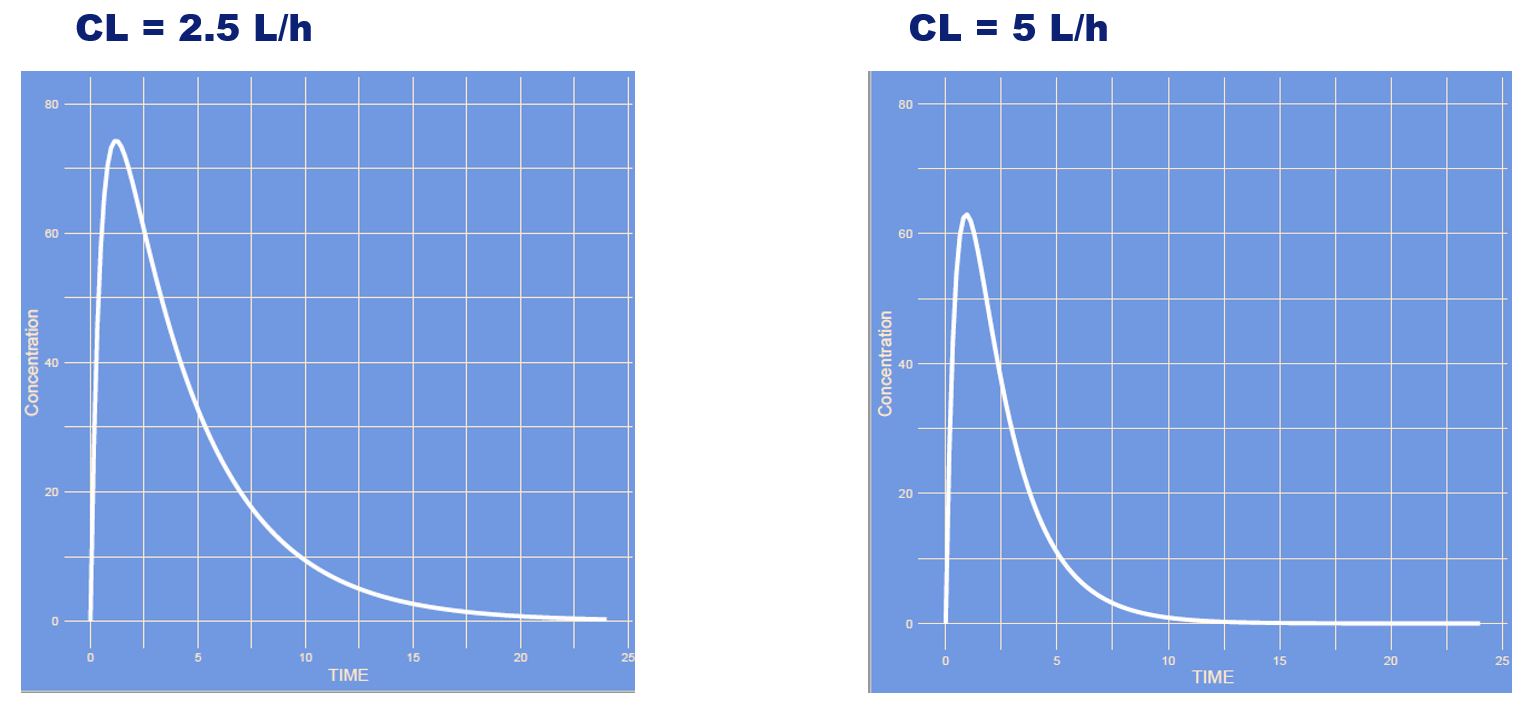
Which parameter is increasing?

Answer
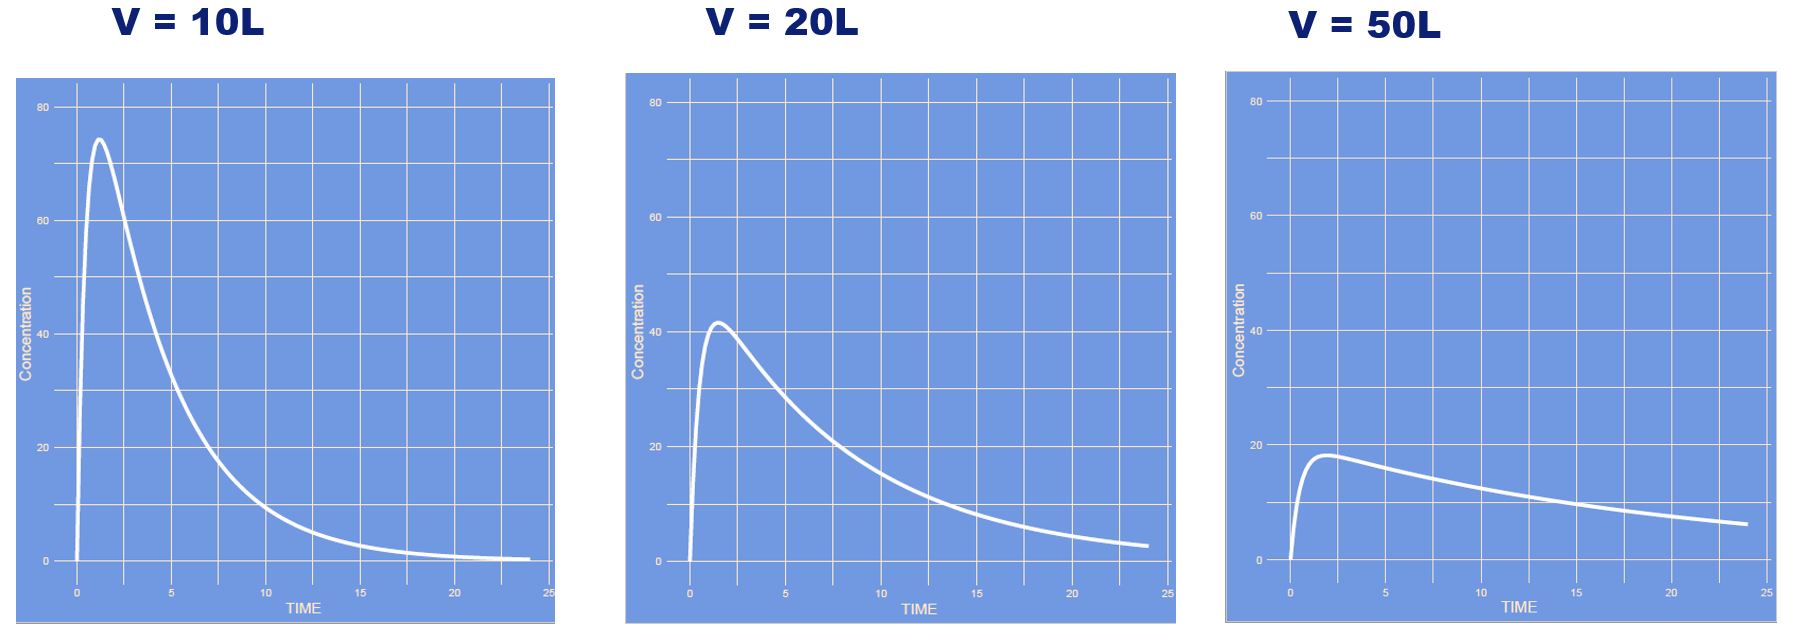
The volume of distribution increased and all other parameters remained unaltered. This is a one compartment model which only has one compartment (if you don't count the absorption compartment). It is the compartment often refered to as the central compartment.
Which parameter is decreasing?
Answer
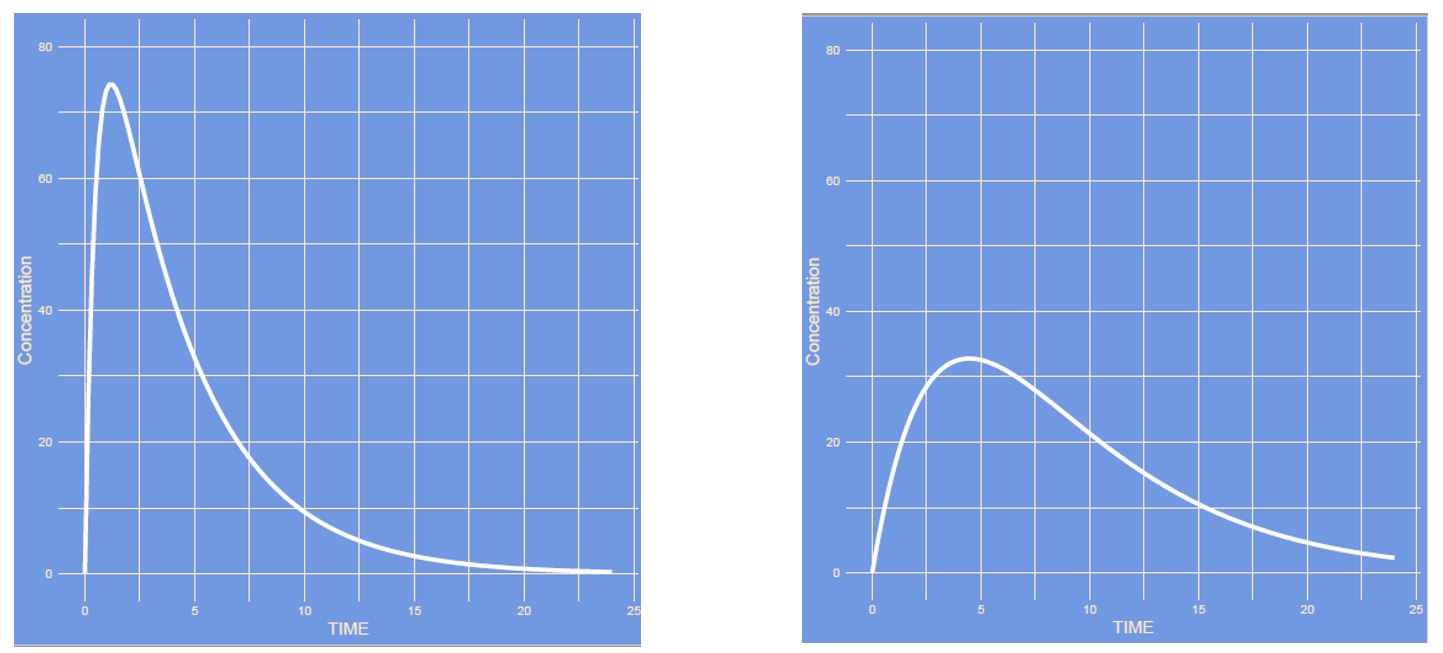
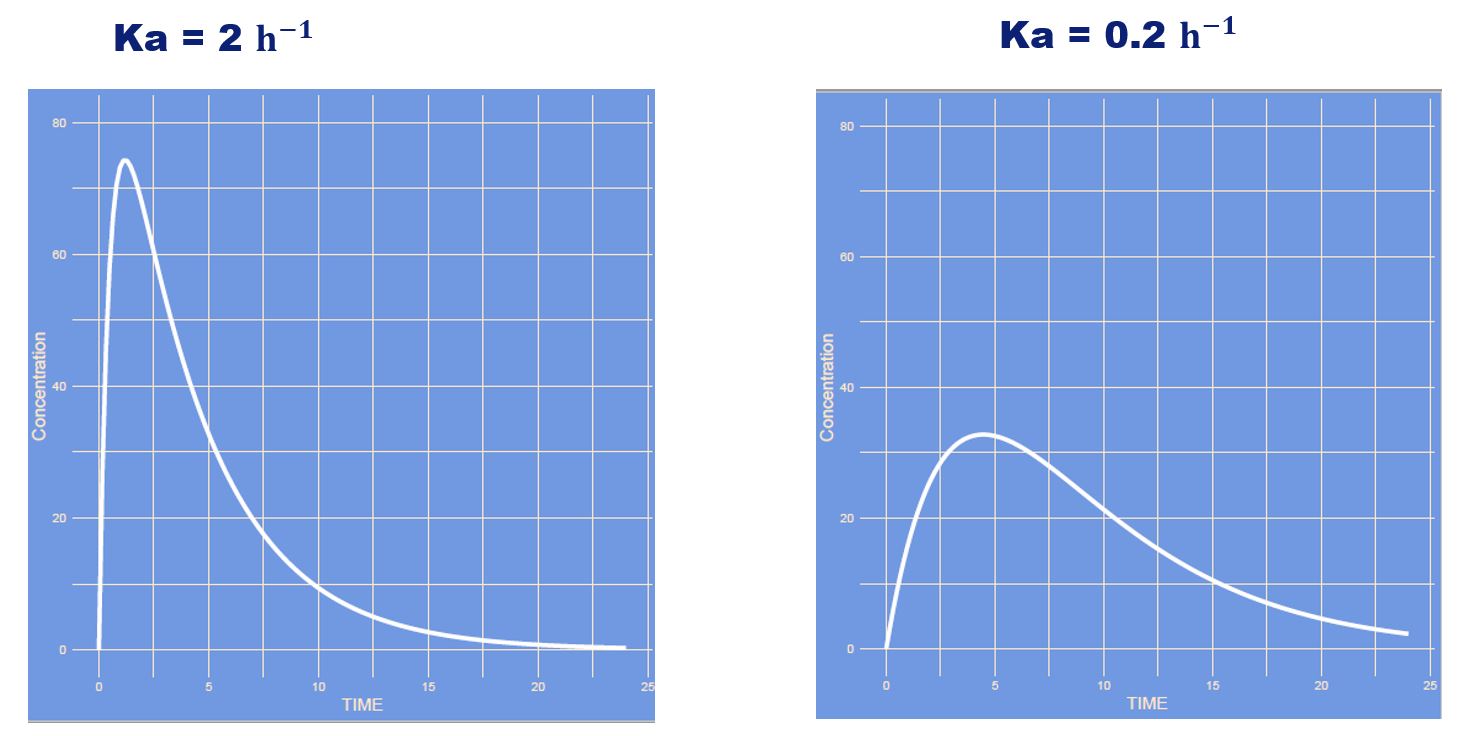
The absorption rate (ka) and all other parameters remained unaltered. It is the first part (the increasing slope) which has the most notable difference. The increasing slope (ka) is slowed down. The peak is lower due to the unaltered clearance which plays a factor together with the absorption and distribution value to obtain maximum concentration. Note how the time to maximum concentration increased.
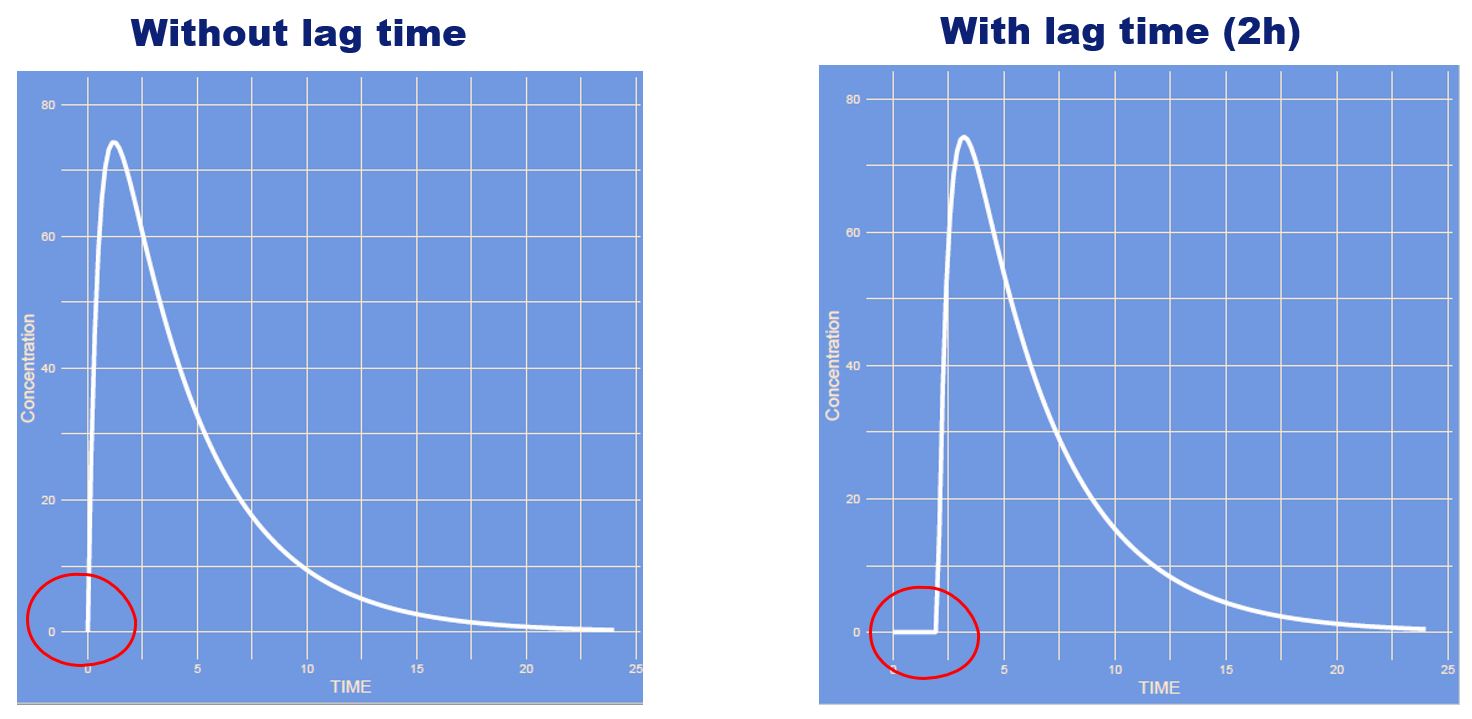
Which parameter has changed?
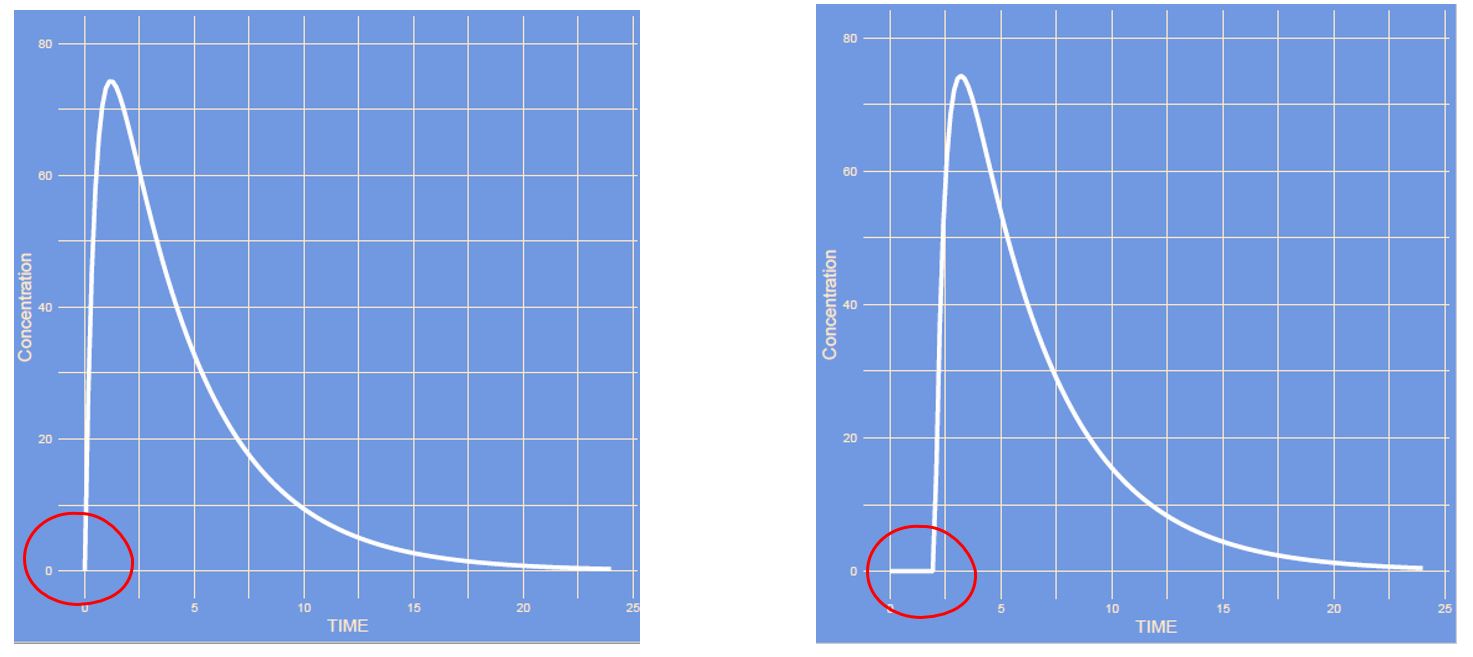
Answer
It's the lag time. The time it takes for the absorption to start. Think of pharmaceutical availability, dissolution of e.g. a tablet.
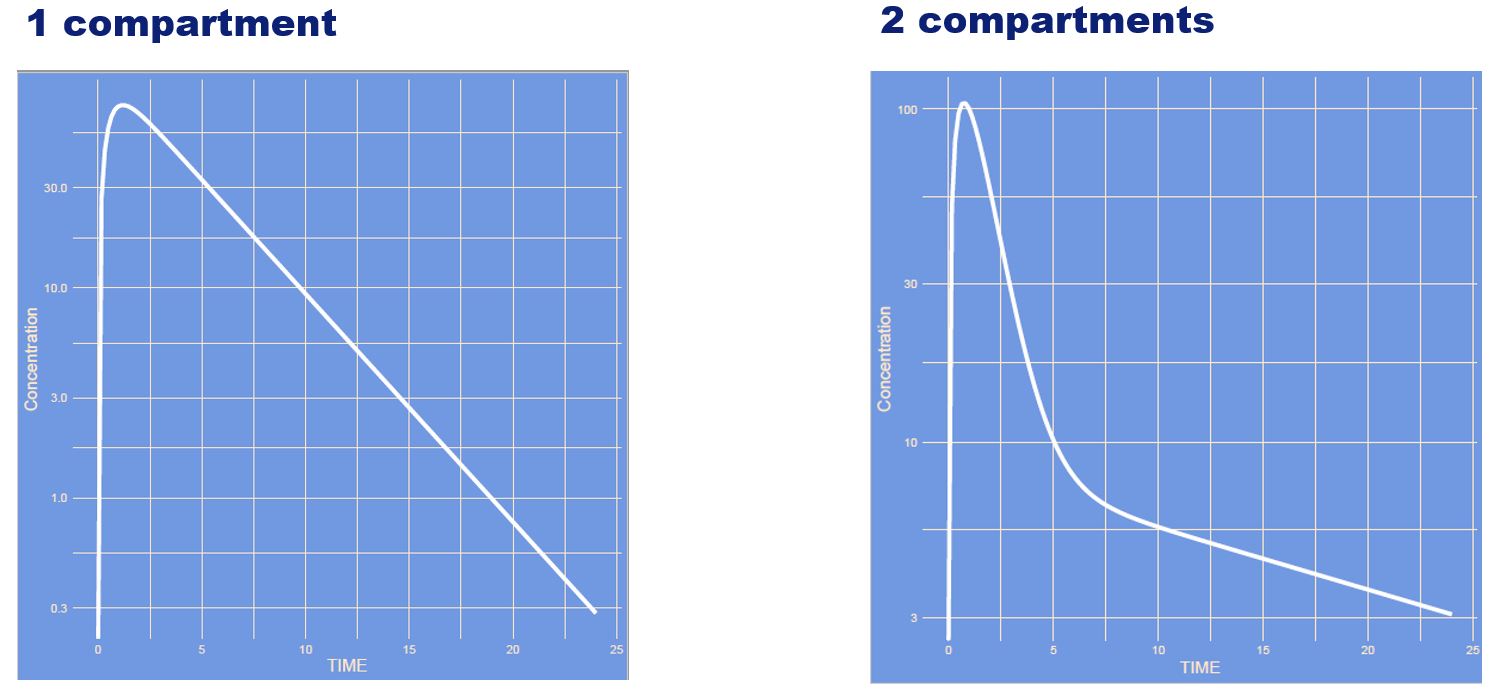
What has changed? (note: semi log scale)
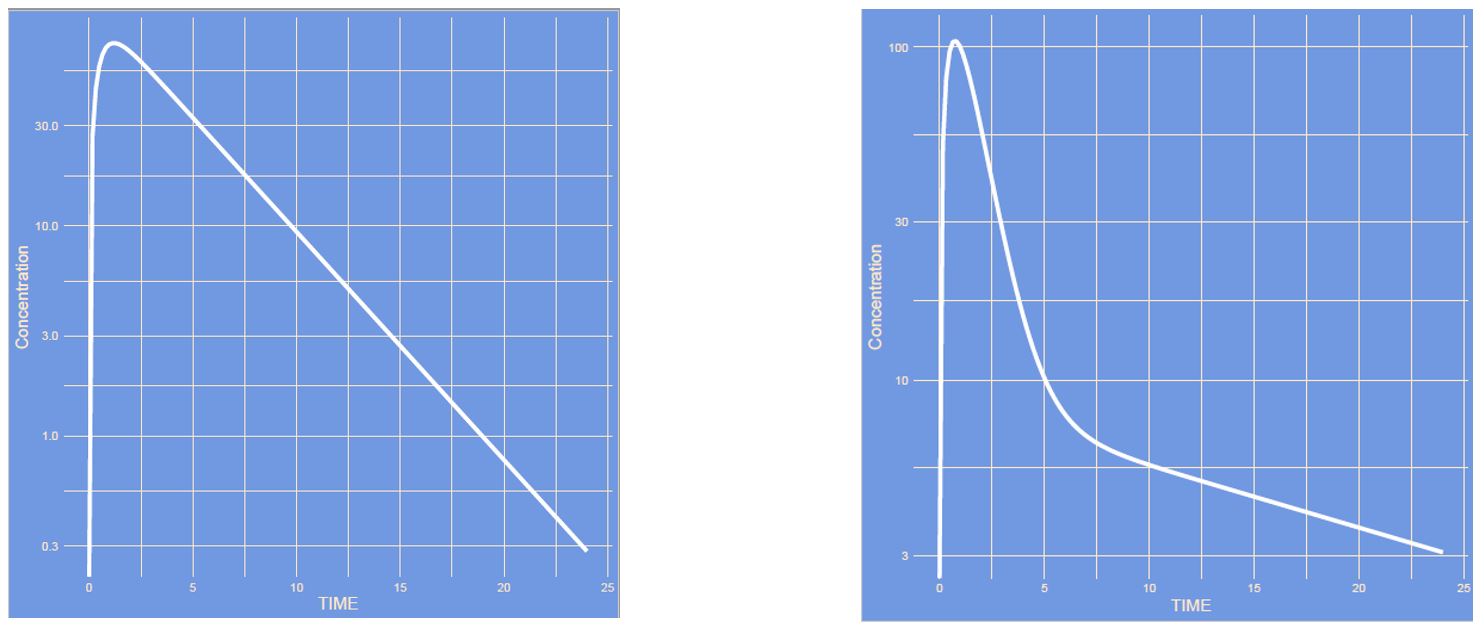
Answer
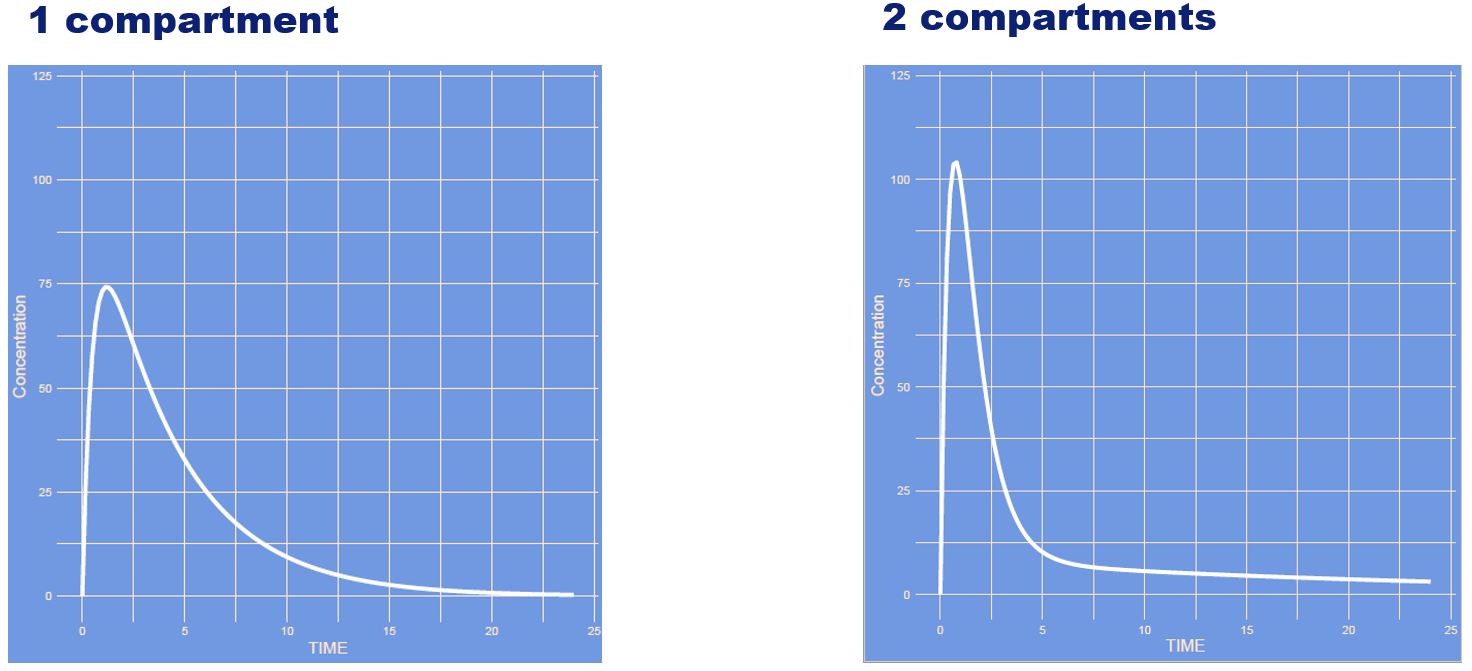
The structure of the model has changed from a one-compartment model to a two-compartment model. It is easier to see this on a semi log scale compared to a linear scale:
Semi log scale
Linear scale:
What has changed? (note: semi log scale)

Answer
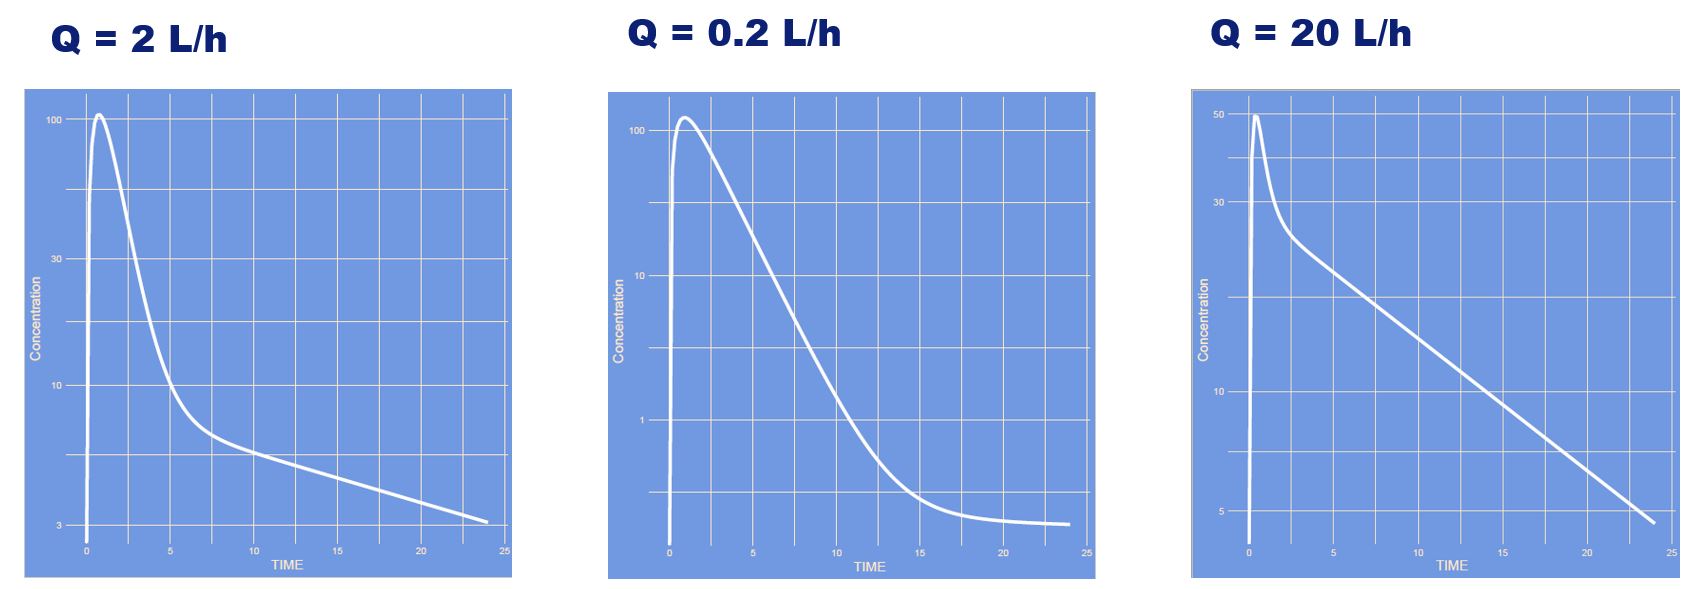
The intercompartmental clearance has changed (Q) which is the distribution between the to volumetric compartments (V1 and V2). If Q is high distribution between the compartments is quick if Q is large it is slow.
What has changed? (note: semi log scale)
Answer
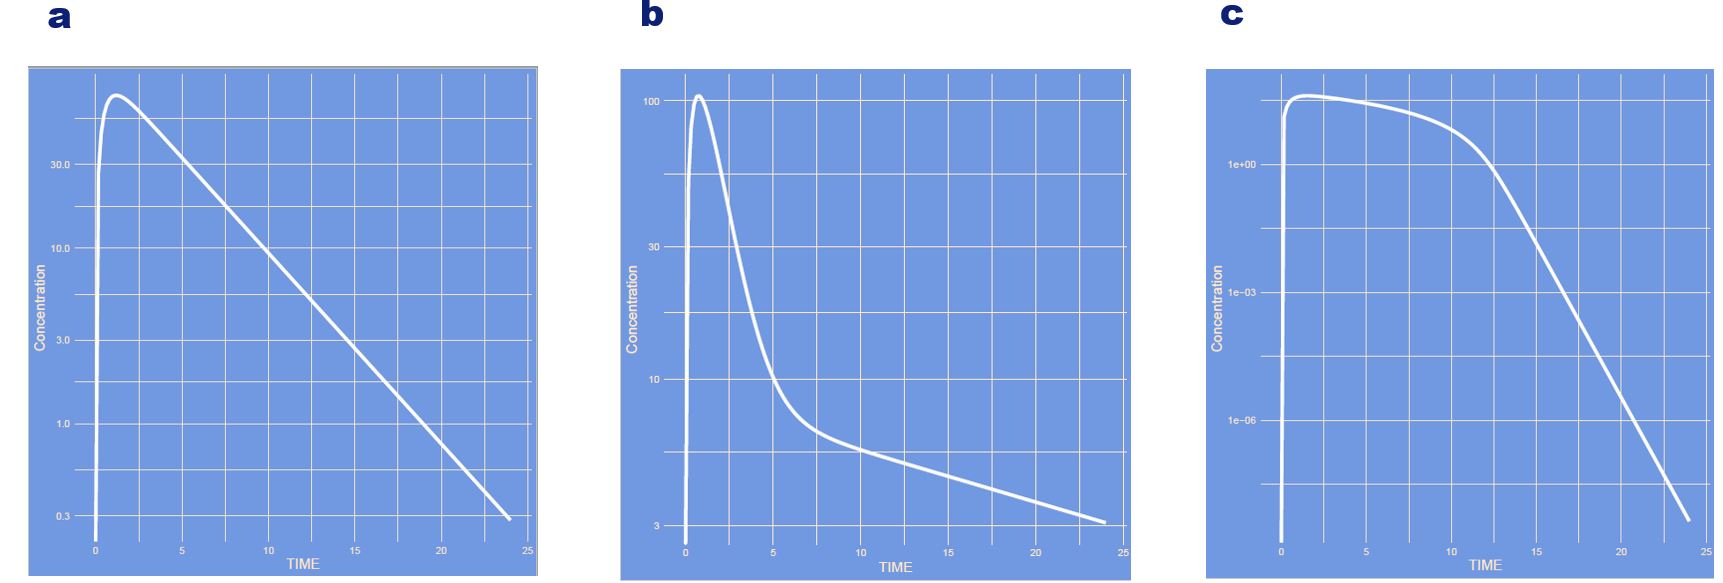
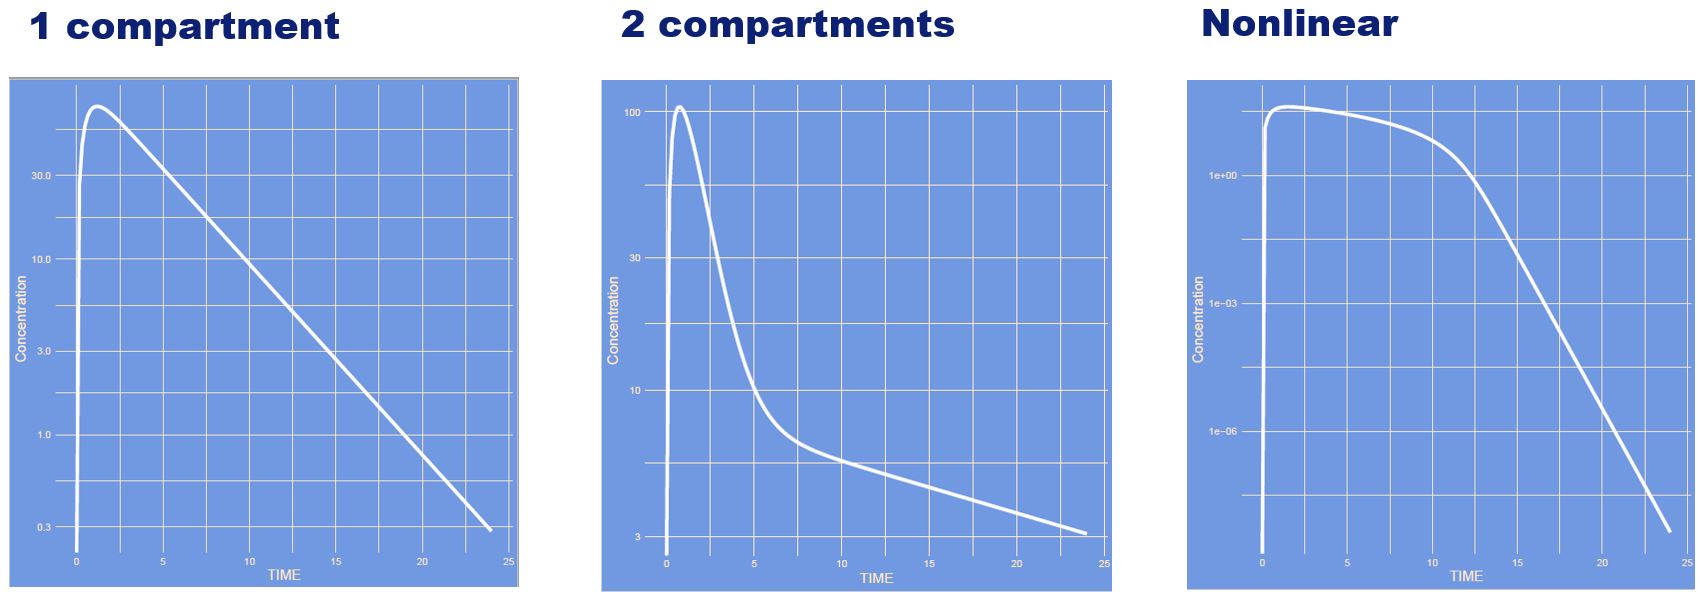
The model has changed showing a one-compartment, two-compartment and a saturation model.
What has changed?
Answer
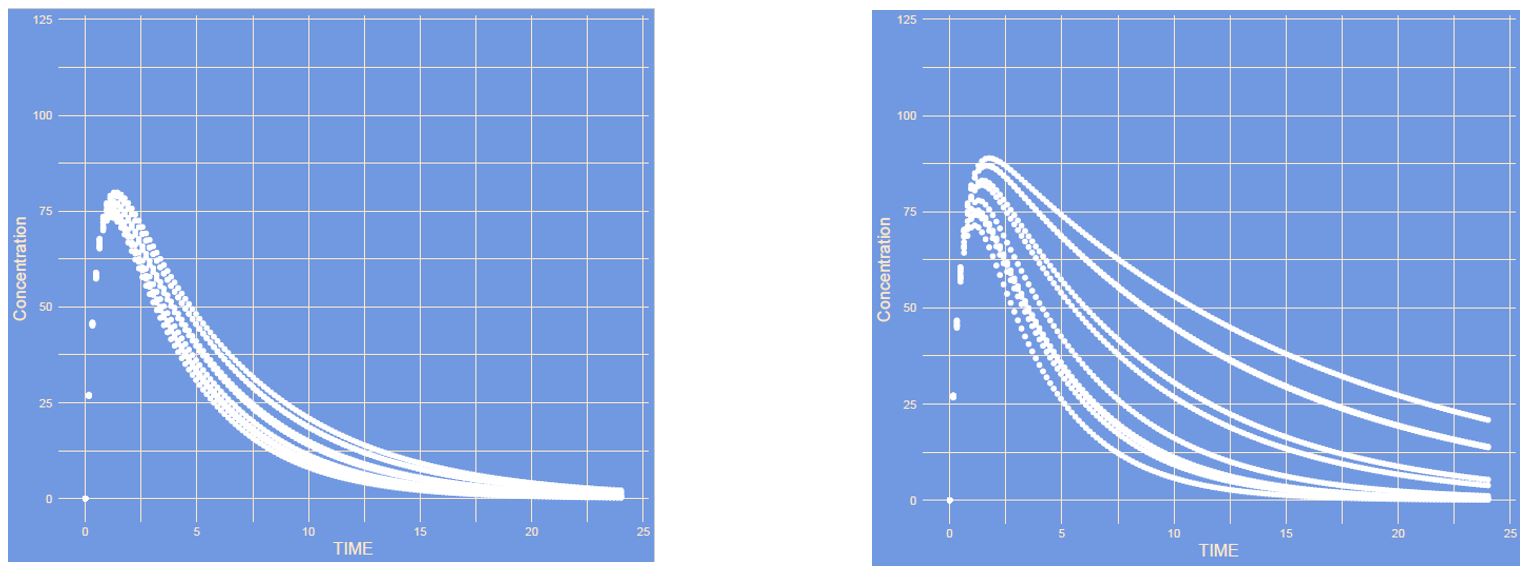
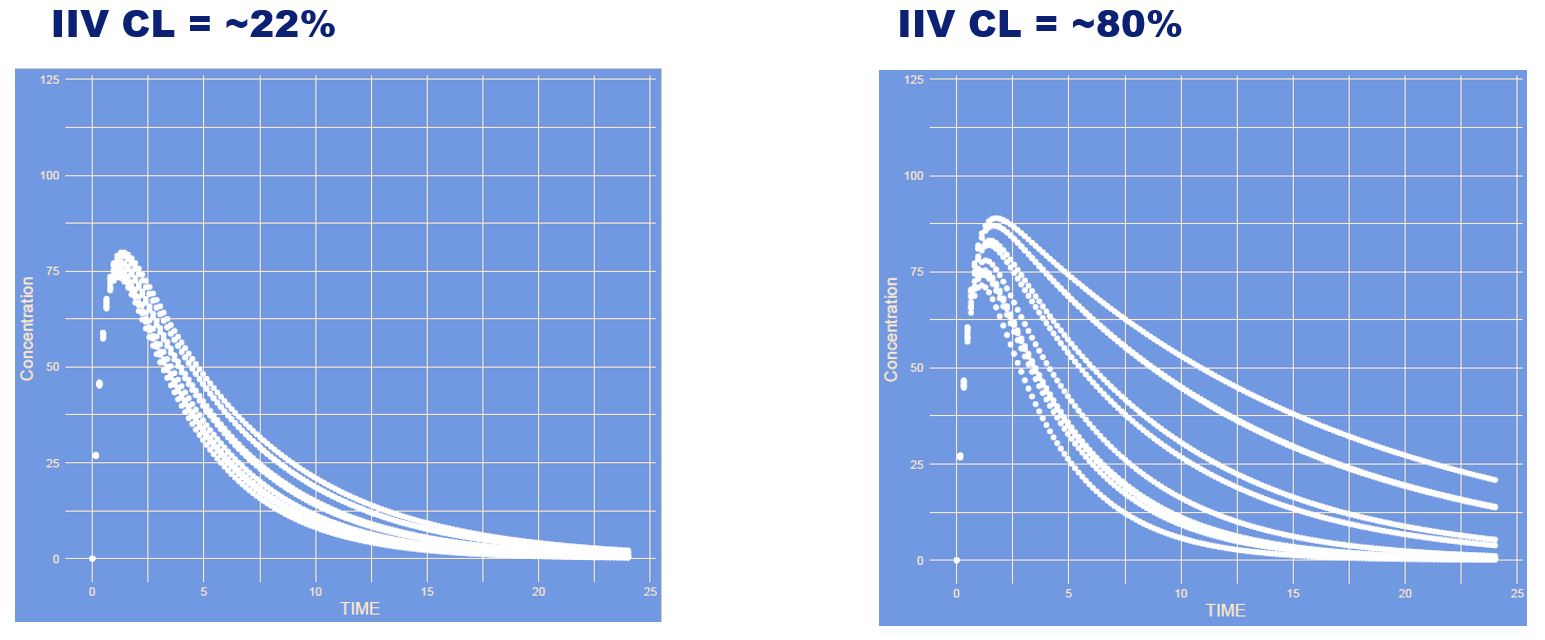
The inter individual variability (IIV) of clearance is increased. The more variability the larger differences between patients. Here you see different curves of patients all with their own CL within the possible range.
What has changed?
Answer
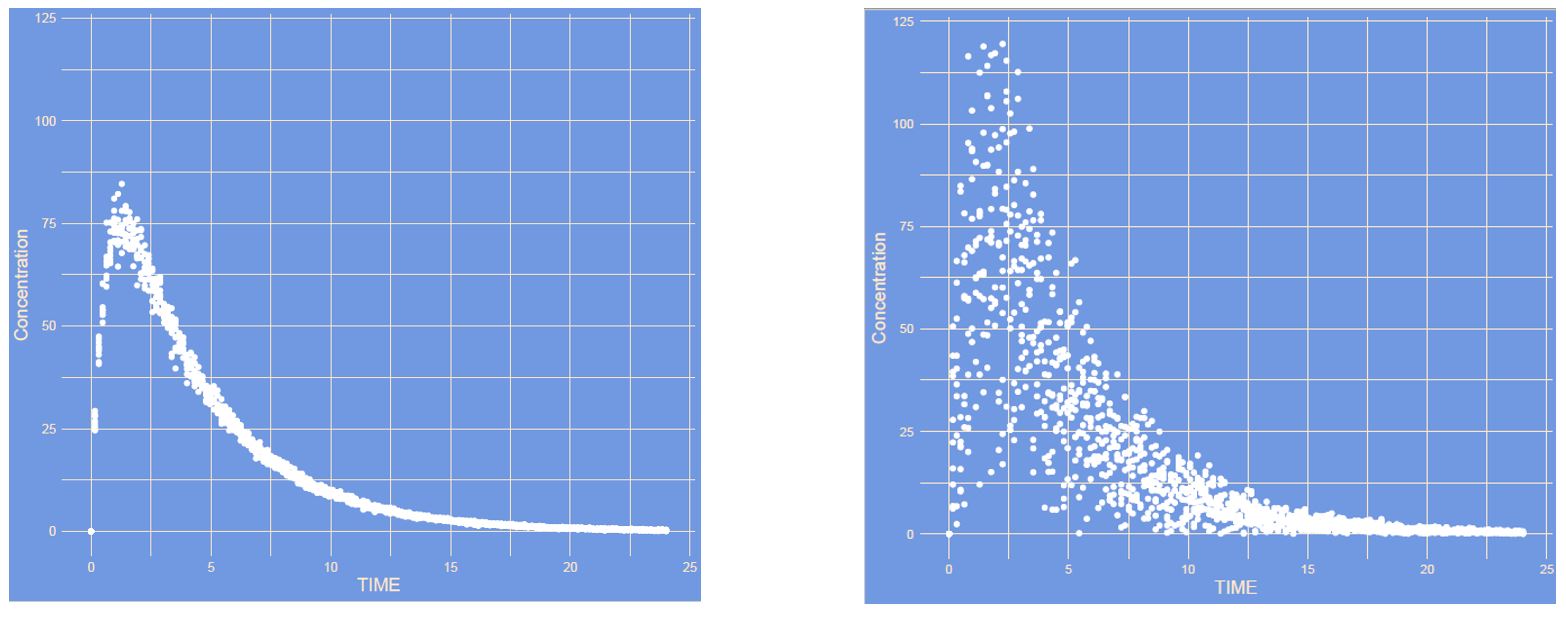
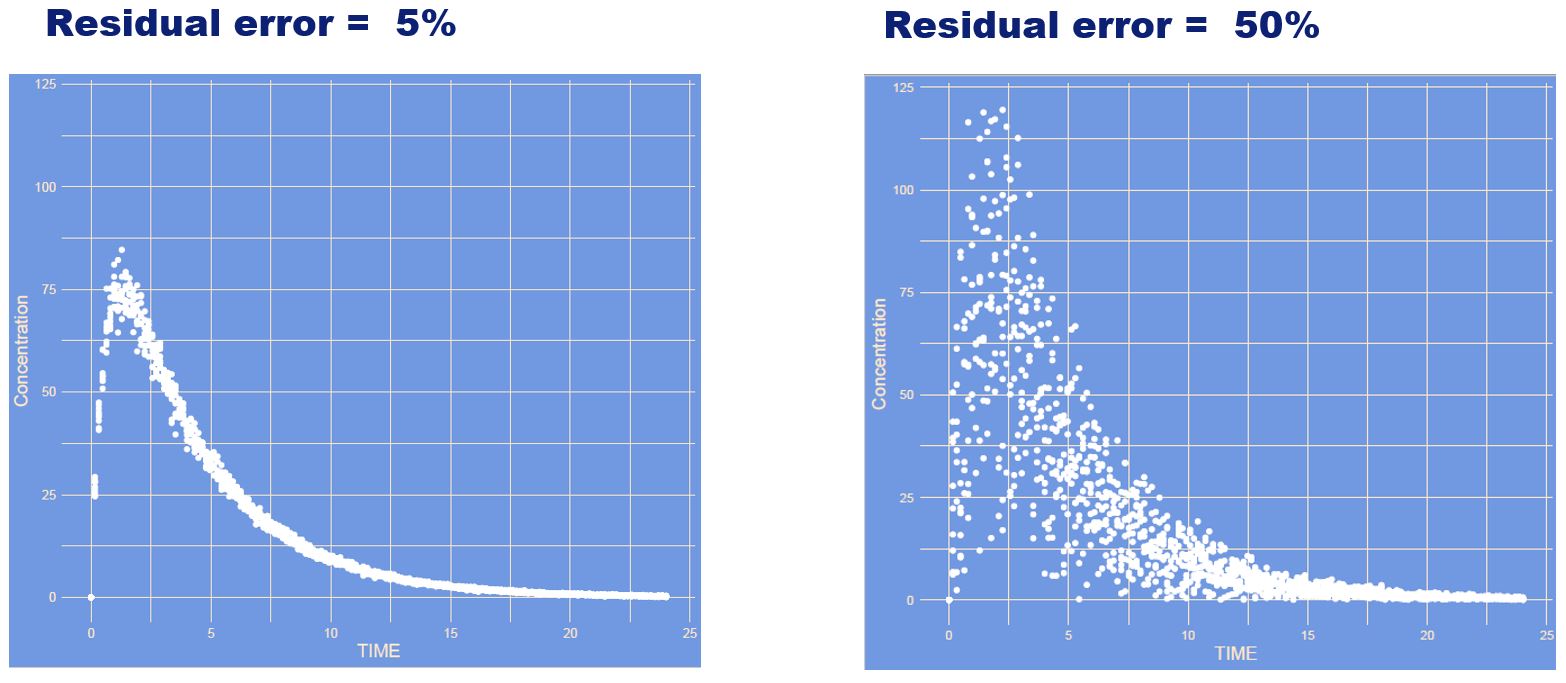
In this case the residual error increased. This is in a proportional manner where larger absolute differences are observed in high concentration and smaller differences in low concentrations.
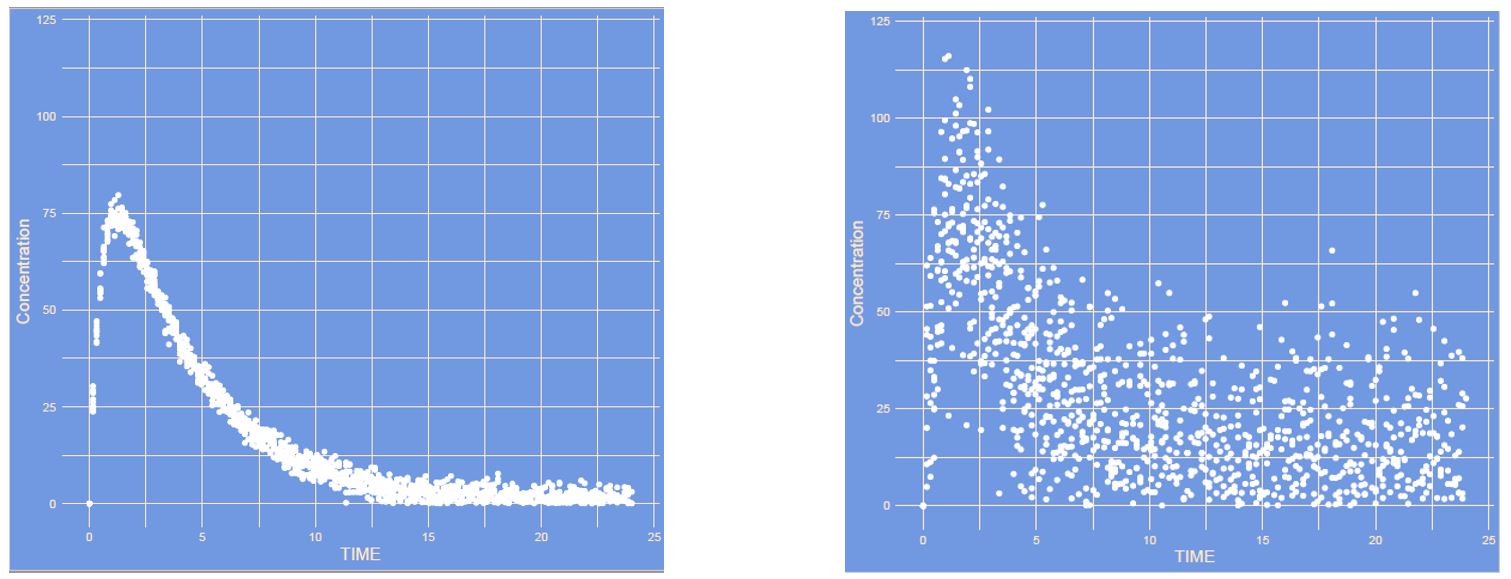
What has changed?
Answer
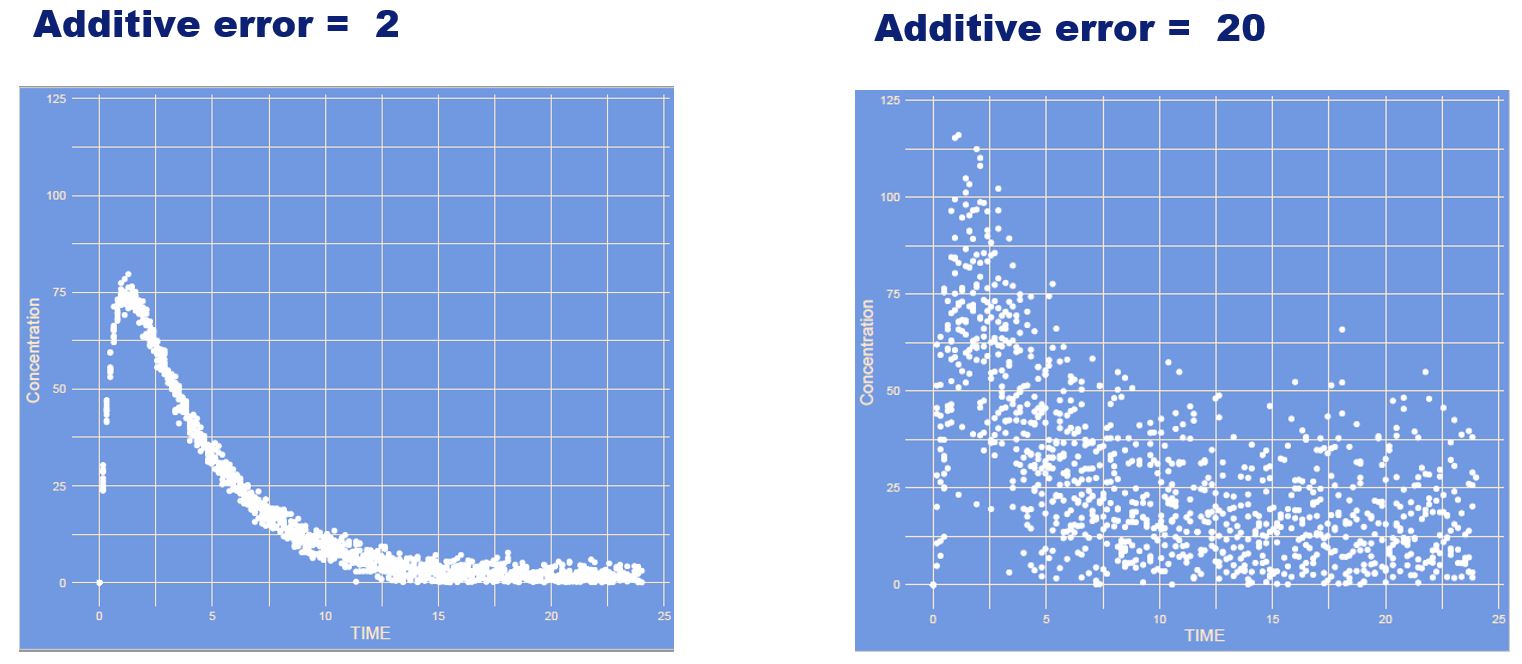
Again the residual error increased. However, this time it is a constant (also often referred to as additive) manner. Absolute differences for high and low concentrations are the same.
What has changed?

Answer
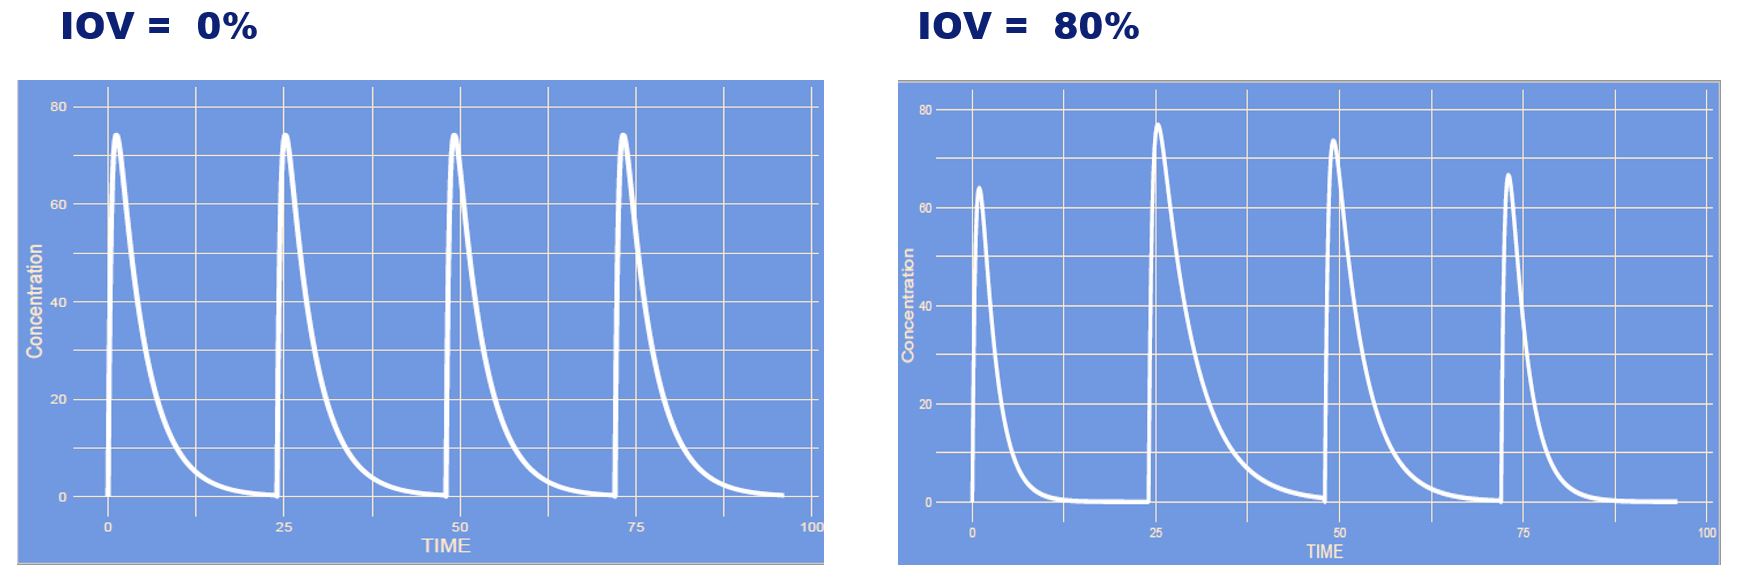
This is an increase in inter occasion variability (IOV). The occasions in this case are each new administration (or curve), with higher IOV each curve can differ more from the other curve, whereas with no IOV all curves remain the same each time.
